
The latest consumer perception data from Wine Intelligence shows that the quality perceptions and attitudes towards Australian wine have improved over the medium term. For the past few years, Wine Australia has engaged Wine Intelligence to measure the perception of Australian wine in key markets. For 2019, these markets were Australia, the United States of America (USA), the United Kingdom (UK), China, Hong Kong, English-speaking Canada, French-speaking Canada (Québec), Singapore, Japan and South Korea.
Market size
Looking at the number of Australian wine drinkers in these key markets (Figure 1), there are positive trends in the UK, China and South Korea in recent years. This is especially encouraging when considering the UK market, where Australia has been number one in the off-trade for many years and the number of Australian wine drinkers is still growing in a market where overall consumption growth is flat.
The number of Australian wine drinkers in Japan grew in the most recent year as well. This aligns with recent good Australian wine export figures for Japan; exports grew by 16 per cent to $55 million in value. Although the number of Australian wine drinkers in Singapore looks relatively small, it represents the highest market penetration[1] of these key markets (aside from Australia), at 59 per cent (see Figure 2).
Figure 1: Number of Australian wine drinkers (millions)

(Source: Wine Intelligence)
The number of wine drinkers in China continues to grow and, pleasingly, the number of Australian wine drinkers has doubled since 2013. Figure 1 illustrates that the number of Australian wine drinkers has been on an upward trend; however, Australian wine’s market penetration has been stable, around 30 per cent for the last three years. In contrast, Chinese domestic wine and French wine have both declined in market penetration over the same period.
Figure 2: Per cent of wine drinkers who have consumed Australian wine in the past six months

(Source: Wine Intelligence)
Long term trends in quality perception
Most key markets have experienced an increase in the quality perception of Australian wine since 2010. Survey respondents are asked to rate the quality of wines from Australia and its competitors from 0 to 10; the average scores over time are illustrated in Figure 3.
Figure 3: Average quality perception score of Australia wine (rated from 0 to 10)

(Source: Wine Intelligence)
While China has had the strongest growth in perceptions of Australian wine (both in the short and long term) – and the USA has dipped in the most recent year – the USA, Singapore, and Hong Kong have improved their perceptions of Australian wine in the long term.
Contributing to China’s high perceptions of Australian wine is the fact that 74 per cent of Chinese drinkers of Australian wine consider Australian wine to be fine or expensive, compared with 72 per cent of people in the Australian domestic market and fewer in the other markets.
Also helping perceptions grow in China is a much higher diffusion of Australian wine marketing, with 54 per cent of respondents indicating that they have seen a promotion for Australian wine, compared with 16 per cent of respondents in the UK and 18 per cent in the USA. This is also an indication of how saturated the USA and UK markets are when it comes to wine marketing and how difficult it is to cut through.
Attitudes towards Australian wine
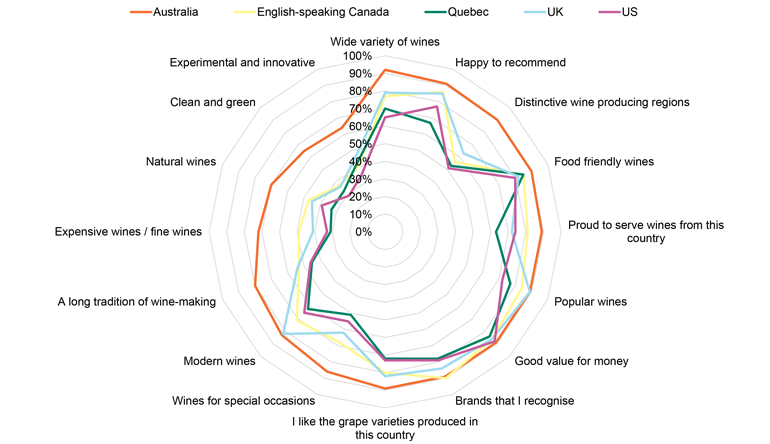
An analysis of the attitudes most associated with Australian wine reveals that ‘food friendly wines’ and ‘good value for money’ are the most common associations with Australian wine across all markets. ‘Happy to recommend wines from this country’ is also a popular association.
Looking at the European, North American and the Australian markets (Figure 4), besides the domestic market, the UK has the highest positive attitudes towards Australian wine, followed by English-speaking Canada. The UK scores nearly the same as the domestic market when it comes to classifying Australian wines as ‘popular’ and ‘modern’.
Interestingly, English-speaking Canada scores the highest of these markets when it comes to ‘brands that I recognise’, providing an indication of the strength of Australian brands in this market.
Figure 4: Attitudes towards Australian wine in European, North American and the Australian markets
(Source: Wine Intelligence)
Figure 5: Attitudes towards Australian wine in Asian markets

(Source: Wine Intelligence)
When it comes to the Asian markets, China is the clear standout followed by Singapore. Compared with Hong Kong, Japan and South Korea, Australian wine drinkers in Singapore are much more likely to associate Australia with grape varieties that they enjoy, a wide variety of wines, distinctive wine producing regions and having a long tradition of winemaking. The Asian markets are also more likely to think of Australian wine as ‘natural’ or ‘clean and green’ compared to their European and American counterparts.
USA shows the greatest attitude change since 2015
Figure 6: Associations with Australian wine in the USA, 2015 vs. 2019

(Source: Wine Intelligence)
The market that showed long-term growth in the greatest number of attitudes towards Australian wine is the USA; of the 11 attitudes that have been tracked consistently during the past 5 years, 10 of them have improved and 1 remains unchanged (food friendly wines). The associations that have grown the most are ‘a long tradition of wine-making’, ‘I like the grape varieties produced in this country’, and ‘I am proud to serve wines from this country’.
Although progress in the world’s largest wine market is slow, this data shows that the hard work of Australian wine producers to change the perception of Australian wine is the USA is having a positive impact.
[1] Per cent of wine drinkers who have consumed Australian wine in the past six months