
Australia is the eighth most attractive wine market in the world, according to Wine Intelligence[1]. It climbed 9 places between 2022 and 2023, driven mainly by general economic metrics including population growth, increases in Gross National Income and Gross Domestic Product (GDP) per capita, and a fall in unemployment.
According to World Bank figures, Australia's GDP per capita grew by 17 per cent in 2022, while the figures for other major geographic regions including the European Union (down 3 per cent) and United Kingdom (down 2 per cent) declined (Figure 1).
Figure 1 - GDP per capita in major countries/geographic regions
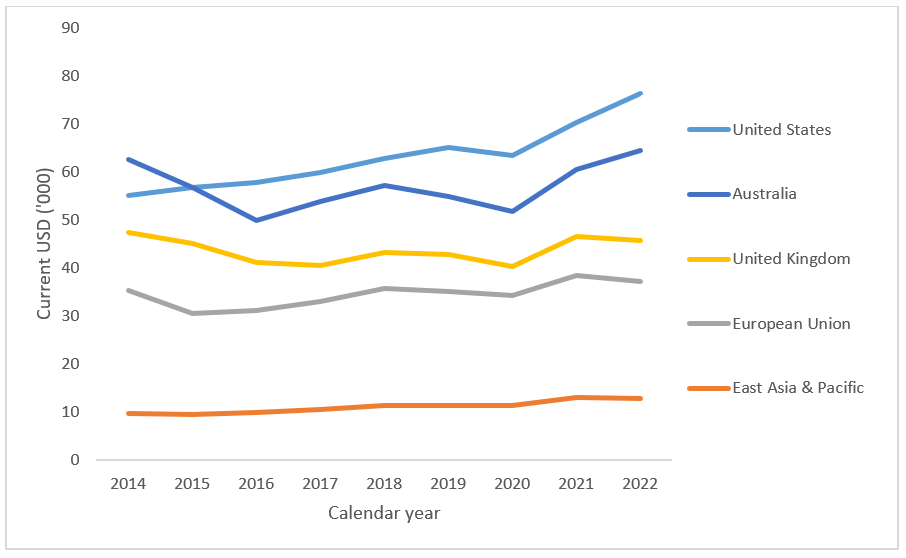
Source: World Bank data shown in Wine Australia Grape Price Indicators dashboard
It is no surprise that other wine-producing countries are targeting this market in a competitive, free-trade global environment, characterised by declining demand and excess supply.
Imported wine has an estimated 20 per cent share by volume on the domestic market in Australia[2]. Currently, New Zealand (NZ) accounts for approximately half of all imported wine, followed by France (20 per cent), Italy (17 per cent) and others (10 per cent).
According to customs figures[3], total wine imports have grown from 82 million litres in 2014 to 106 million litres in the year ending 2023. This is a compound average annual growth rate (CAGR) of just under 3 per cent. Imports peaked at 109 million litres in 2021 (Figure 2).
Figure 2 - Wine imports into Australia over time

Source: Australian Bureau of Statistics
Not all import growth may be as it seems
Looking at imports by source country reveals that imports of wine from NZ increased by 31 per cent in the year ending June 2023, driven by a 52 per cent increase in bulk wine, which reached its highest volume ever (Figure 3), and its highest ever share of NZ imports at 62 per cent, compared with 39 per cent in 2019 and 24 per cent 10 years ago.
Figure 3 - Wine imports from New Zealand to Australia by container type

Source: Australian Bureau of Statistics
However, this sudden jump in NZ imported wine is not reflected in the off-trade sales figures, which indicate a decline in volume of NZ (Marlborough) wine of 4 per cent in the latest 12-month period (year ending 2023)[4]. While a lag is expected between wine being imported and being available for sale, it seems unlikely that there is a commercial driver (consumer demand) for the large increase in NZ Sauvignon Blanc evident in the customs figures.
The alternative is that at least some of the wine reported by the ABS is not intended for consumption on the Australian domestic market. Normally, this wine would not clear customs and would not be visible in the import figures. However, because there is a free trade agreement between NZ and Australia, it is possible that the wine does clear customs, is packaged in Australia and then re-exported.
The customs figures for re-exports from Australia (wine of foreign origin passing through customs in Australia on the way to other destinations) show that 13 million litres of wine were reported as 're-exports' from Australia in the year ending December 2022.
The amount of re-exported wine has increased from 3 million litres in 2017, with a sudden and significant increase occurring in 2020 that has continued for the past three years (Figure 4).
While the origin of the re-exported wine cannot be determined, its destination after leaving Australia can be identified. In 2022, 44 per cent was sent to the United Kingdom (UK), followed by the United States (18 per cent) and Sweden (8 per cent). In 2023, only 6 per cent went to NZ, compared with 19 per cent in 2017 (Figure 4). This is consistent with a greater share of the wine now being of NZ origin (and therefore unlikely to be returned home). Further indirect support for this conclusion is that the share of white wine in the re-exports is 87 per cent, whereas in 2017 only 58 per cent was white.
Figure 4 - Destinations of wine re-exported from Australia since 2017 by destination market

Source: Australian Bureau of Statistics
Therefore, while it cannot be confirmed, these figures strongly suggest that there has been an increase in NZ white wine entering Australia in bulk for packaging and re-exporting, primarily to the UK and US. This practice is likely to inflate the imported wine consumption figures by up to 10 per cent.
Italy and France account for another 40 per cent of imported wine in Australia. Imports from France and Italy have both grown by a CAGR of around 7 per cent since 2014. However, in the past 2 years, these have started to decline, suggesting that the increase in NZ imports may be masking an overall decline in the volume of imported wine consumption in Australia.
Figure 5 - Imports of wine to Australia from Italy and France over the past 10 years

Source: Australian Bureau of Statistics
However – imports still represent a growing source of competition in Australia
Wine listings in the on-premise (bars, clubs and restaurants) provide an insight into the profile of imported wines on the Australian domestic market and, although they don’t necessarily correlate with sales volumes, they do indicate the trends in wine offerings available to consumers.
According to Wine Business Solutions[5], all Australian wine-producing states and New Zealand lost ground to European countries in 2023 in terms of share of wine listings across Australia. Overall, wine listings from France increased by 16 per cent to be second only to South Australia, while Italy grew 1 per cent to take third spot from Victoria, which slipped from second to fourth. Including New Zealand, imports held four of the top 10 places.
Another warning sign is that, although the volume of French wine imports may have declined in the past 12 months, the value increased by 9 per cent overall, driven by Champagne (up 30 per cent) and packaged dry red (up 9 per cent)[6]. Overall, French wine imports account for 49 per cent of the total value of imports and, with this increasing, it is likely to take a growing share of wine consumers’ disposable income, which is already under pressure.
The real threat is not coming from imported wine
Despite the above, it is worth noting that the main threat to Australian wine sales on the domestic market is not coming from imported wine, but from other alcoholic and non-alcoholic drinks. Much has already been written about the trends driving reduced wine consumption globally (e.g. see our recent market bulletin).
The latest On-Premise Sales report[7] highlights how these trends are playing out in Australia’s bars, clubs and restaurants – exacerbated by recent cost-of-living pressures. Compared with 2022, total spend on alcohol in the on-premise in the 12 weeks to 26 August 2023 was down 16 per cent compared with the same period 12 months ago, while for wine, the total spend was down 25 per cent. The number of ‘tickets’ – i.e. wine purchases – has been declining steadily over the past 12 weeks, to sit currently at around two-thirds of what they were in the same week in 2022 (Figure 6). By contrast, beer and spirit tickets, while declining over that time, have only reduced by around 20 per cent.
Figure 6 - Ticket count for wine purchases by week on the on-premise

Source: CGA by NIQ
This shows that wine drinkers are reducing their spend by more than the average on-premise alcohol consumer, either because, as a cohort, they are more likely to be reducing their number of visits, or because they are switching to a different drink when out (more than other alcohol consumers are).
Read more about the importance of the on-premise in Australia for wine producers.